Tour Reporting & Analytics Software – Tour Management Made Right
Tour Reporting and Analytics for Operators
Tour reporting analytics that show exactly how every tour, driver, and route performs. Tour Management Made Right generates automated reports on revenue, mileage, tips, and profitability so you can make decisions based on real numbers instead of gut feeling.
Automated Tour Reports
Every completed tour generates a report automatically. Driver hours, guest count, mileage, revenue, and tips are all captured without anyone filling out a form.
Reports are ready the moment the tour ends. No waiting for drivers to submit paperwork at the end of the week.
Driver Mileage and Tip Summaries
Track mileage per driver, per tour, and per vehicle. Tip breakdowns show exactly how much each driver earned on every trip.
Use these summaries for payroll, reimbursement calculations, and driver performance reviews.

Revenue Dashboards
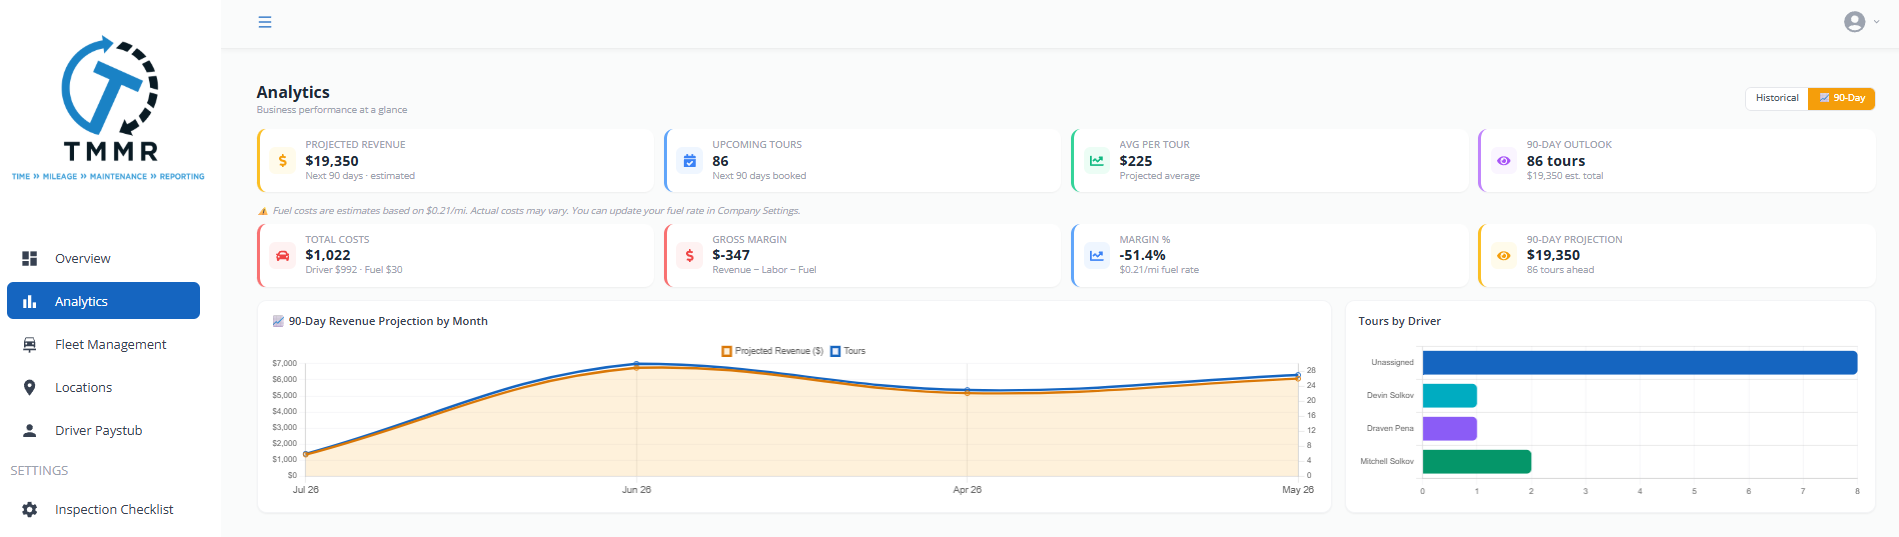
See total revenue, average revenue per tour, and revenue by tour type on a single dashboard. Filter by date range, driver, vehicle, or client to drill into the numbers that matter.
Spot trends quickly. Identify which tours bring in the most revenue and which ones need attention.

Per-Tour Profitability and CSV/PDF Export
Calculate profitability for each tour by comparing revenue against driver costs, fuel, tolls, and other expenses. Know which tours actually make money and which ones just look busy.
Export any report to CSV or PDF with one click. Share with your accountant, partners, or keep for your own records.

How It Works
From raw tour data to actionable reports in three steps.
Run Your Tours
Tour Management Made Right automatically captures mileage, hours, guest counts, tips, and revenue as tours are completed. No manual data entry required.
Review Dashboards
Open your reporting dashboard to see revenue trends, driver performance, and per-tour profitability. Filter by any dimension.
Export and Act
Export reports to CSV or PDF. Use the data to adjust pricing, optimize routes, reward top drivers, or cut underperforming tours.
Tour Reporting Analytics for Wine Country Seasons
Wine country tourism follows seasonal patterns. Harvest season brings a surge. Winter slows things down. Tour Management Made Right helps you track seasonal trends, analyze peak harvest performance, and break down revenue per winery stop so you can plan staffing and pricing around the calendar instead of reacting to it.
Tour Management Made Right vs. Manual Reporting
| Capability | Manual | Tour Management Made Right |
|---|---|---|
| Tour reports | Drivers fill out forms after the fact | Auto-generated when the tour ends |
| Mileage tracking | Odometer readings on paper | Tracked automatically per tour |
| Tip breakdowns | Cash envelopes + guesswork | Per-driver, per-tour tip summaries |
| Revenue visibility | End-of-month spreadsheet review | Real-time revenue dashboards |
| Profitability per tour | Rarely calculated | Revenue minus costs, per tour |
| Data export | Copy-paste into spreadsheets | One-click CSV and PDF export |
Frequently Asked Questions
What reports are generated automatically?
Every completed tour produces a report with driver hours, mileage, guest count, revenue, and tips. You also get weekly and monthly summary reports.
Can I see profitability per tour?
Yes. Tour Management Made Right calculates per-tour profitability by comparing tour revenue against driver costs, fuel, tolls, and any logged expenses for that trip.
What export formats are available?
You can export any report to CSV or PDF with one click. CSV files are ready for import into accounting software or spreadsheets.
Can I filter reports by driver or tour type?
Yes. Filter by driver, vehicle, tour type, client, or date range on any dashboard or report view.
How is mileage tracked?
Mileage is captured automatically from route data for each tour. You can also enter manual odometer readings if needed.
Do I need to enter data manually?
No. Reports are generated from data already in Tour Management Made Right like bookings, routes, and driver assignments. There is no separate data entry step.
Can I track seasonal trends?
Yes. Date-range filters and trend charts let you compare performance across seasons, months, or any custom period you define.